Common Principal Component Subspace and Clustering Symmetric Positive Semi-Definite Matrices

Hanchao Zhang

Division of Biostatistics, Department of Population Health, Grossman School of Medicine, New York University

Thaddeus Tarpey

Division of Biostatistics, Department of Population Health, Grossman School of Medicine, New York University

Refresh Clustering Algorithm: K-Means

K-Means Algorithm

\[\begin{align*} & \underset{\mathscr C}{\text{minimize }} \underbrace{\frac{1}{n}\sum_{j=1}^m \sum_{k \in \mathscr C_j} \big\Vert x_k - \bar x_{\mathscr C_j}\big\Vert^2}_{\text{within cluster sum of squares}} \\ &\textbf{ OR } \\ &\underset{\mathscr C}{\text{maximize}} \underbrace{\sum_{i=m} \frac{n_{\mathscr C_j}}{n}\cdot\big\Vert\bar x_{\mathscr C_j}\big\Vert^2 }_{\text{between cluster sum of squares}} \end{align*}\] Minimize the Euclidean distance between the data points to its closet centroid

Clustering Centers

\[\begin{align*} \mathbf u_j & = \mathscr E[\mathbf X \vert \mathbf X \in \mathscr C_j] \\ & = \frac{1}{n_j}\sum_{i=1}^{n_j} \mathbf x_i \cdot \delta(\mathbf x_i \in \mathscr C_j), \end{align*}\] where the centers of cluster \(\mathscr C_j\) is the average of the data points that is classified to the group \(\mathscr C_j\).

Symmetric Positive Semi-Definite (SPD) Matrix-Valued Data

Functional Connectivity Matrix

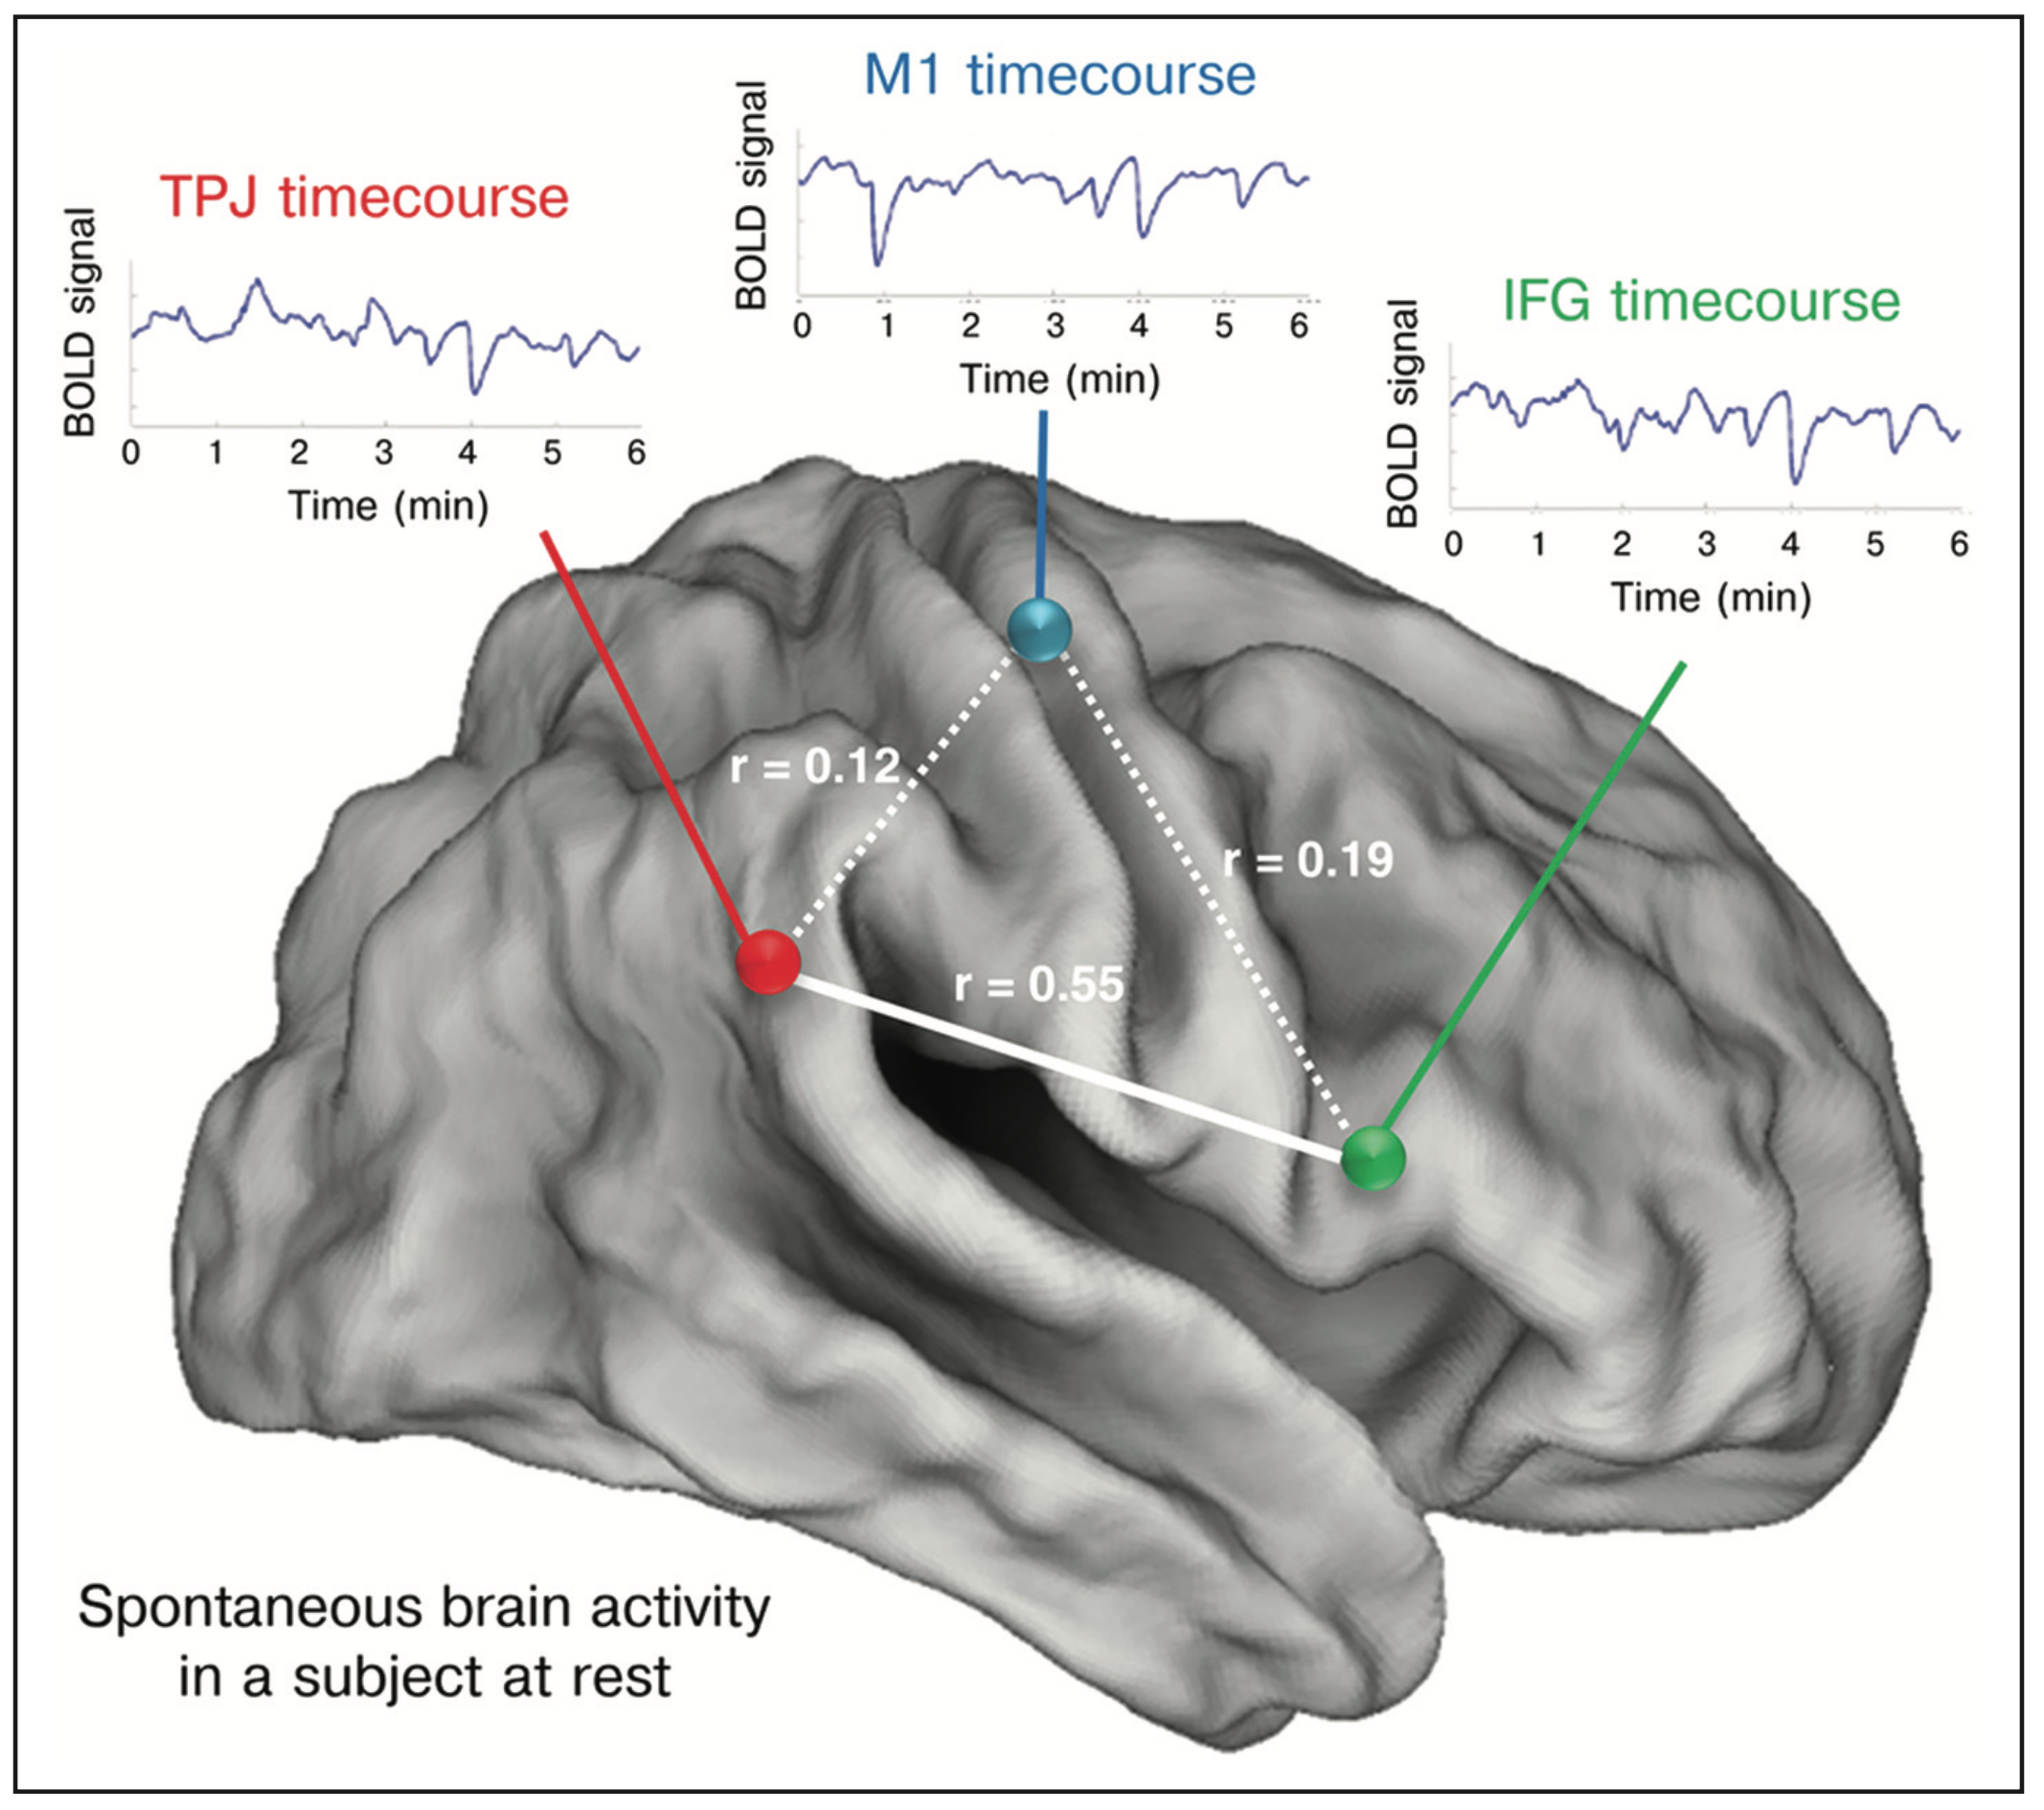
Functional Connectivity. [Gillebert et al., 2013]

Functional connectivity is defined as the temporal coincidence of spatially distant neurophysiological events.

For each participant \(i\), let \(\mathbf{y}_{ij} \in \mathbb{R}^{\mathscr T}\) be the longitudinal measurement of blood oxygen level-dependent (BOLD) signal on the region of interest \(j\), \(j = 1,2,\ldots,p\).

The functional connectivity matrix for participant \(i\) is the covariance matrix of \(\mathbf y_{i}\): \(\mathbf{\Sigma}_i = \textbf{Cov}(\mathbf{y}_i) \succeq \mathbf{0}\)

We want to link the functional connectivity matrix to the clinical outcomes using clustering methods.

SPD Matrices and K-Tensors Algorithm: Clustering SPD Matrices

Positive Semi-Definite Matrices

Examples of Positive Semi-Definite Matrices

  • \(\mathbf \psi_{2\times 2} = \begin{bmatrix} 1 & 0.5 \\ 0.5 & 1 \end{bmatrix}\)
  • \(\mathbf \psi_{3\times 3} = \begin{bmatrix} 1 & 0.5 & 0.3 \\ 0.5 & 1 & 0.2 \\ 0.3 & 0.2 & 1 \end{bmatrix}\)
  • \(\mathbf \psi_{p\times p} = \begin{bmatrix} x_{11} & x_{12} & \cdots & x_{1p} \\ x_{21} & x_{22} & \cdots & x_{2p} \\ \vdots & \vdots & \ddots & \vdots \\ x_{p1} & x_{p2} & \cdots & x_{pp} \end{bmatrix}\)

Visualization

A ellipsoid centered at origin is defined by the set of points \(\mathbf x \in \mathbb R^p\) such that \(\mathbf x^T \mathbf \psi \mathbf x = 1\).

Positive Semi-Definite Matrices Visualization

Principal and Self-Consistent Tensors (Common Principal Component Subspace)

Formulation of Principal and Self-Consistent Tensors

  • let \(\mathbf \Psi\) be a random positive semi-definite matrix, and \(\mathbf \psi\) be an observed PSD matrix
  • let \(\mathscr V_q(\mathbb R^p)\) be the Stiefel manifold, the set of \(p \times q\) matrices with orthonormal columns
  • hyperplane can be define by \(\mathbf B \in \mathscr V_q(\mathbb R^p)\)

Definition 1: pseudo-eigenvalues of \(\mathbf \psi\) with respect to \(\mathbf B\) is defined as \[ \Lambda(\mathbf \psi, \mathbf B) := \arg\min_{\mathbf \Theta} \Vert \mathbf \psi - \mathbf B \mathbf \Theta \mathbf B^T \Vert_F^2 \]

Definition 2: projection of \(\mathbf \psi\) onto \(\mathbf B\in \mathscr V_q(\mathbb R^p)\) is defined as \[\begin{align*} \mathscr P_{\mathbf B}(\mathbf \psi) = \mathbf B \mathbf\Lambda_{\mathbf B}(\mathbf \psi) \mathbf B^\intercal \end{align*}\]

Definition 3: the hyperplane (center) that best approximates \(\mathbf \psi\) is defined as \[\begin{align} & \mathbf B(\mathbf \Psi) = \underset{{\mathbf B \in \mathscr V_p(\mathbb R^p)}}{\arg\min} \ \mathscr E \left\{ \left\Vert \mathbf \Psi - \mathscr P_{\mathbf B}\left( \mathbf \Psi \right) \right\Vert_{F}^2 \right\} \end{align}\]

Principal and Self-Consistent Tensors

Here \(\mathscr T\) \[\begin{align} \mathscr T(\mathbf \Lambda) = \mathbf B(\mathbf \Psi) \mathbf \Lambda \mathbf B^\intercal(\mathbf \Psi) \qquad \forall \mathbf \Lambda \in \mathbb D^+ \end{align}\] defines the princpal and self-consistent tensors which is also the common principal component subspace, where \(\mathbb D^+\) is the set of all diagonal matrices with non-negative values.

Theorem 1: By minimizing \[\begin{align} & \mathbf B(\mathbf \Psi) = \underset{{\mathbf B \in \mathscr V_p(\mathbb R^p)}}{\arg\min} \ \mathscr E \left\{ \left\Vert \mathbf \Psi - \mathscr P_{\mathbf B}\left( \mathbf \Psi \right) \right\Vert_{F}^2 \right\}, \end{align}\]

we can show that \(\mathbf B(\mathbf \Psi)\) is the matrix of eigenvectors of the second moment of the distribution of \(\mathbf \Psi\).

K-Tensors Clustering Algorithm for SPD Matrices

Algorithm:

  1. start with a random partition of the data
  2. compute the \(\mathbf B\) for each partition
  3. reassign all the matrix to the closest \(\mathbf B\) by
  4. repeat until convergence

Simulation Study

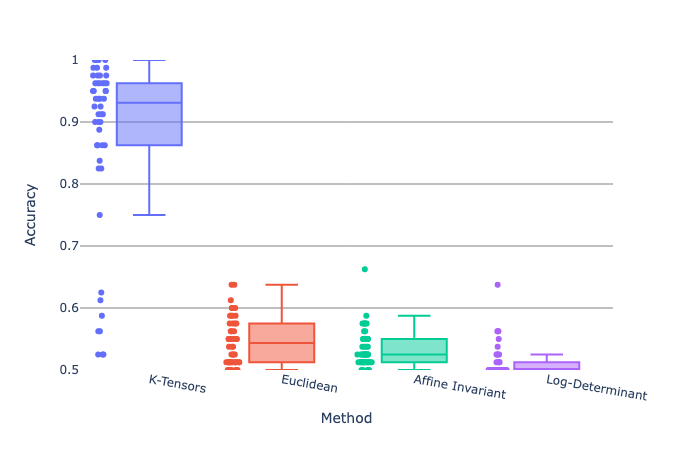
Simulation Setting 1

\[\begin{align*} \mathbf \psi_{k_i} & = \mathbf B_k (\mathbf D_i + \mathbf E_i) \mathbf B_k^\intercal \\ & = \mathbf B_k \mathbf D_i \mathbf B_k^\intercal + \mathbf B_k\mathbf E_i \mathbf B_k^\intercal, \end{align*}\] and \[\begin{align*} \mathbf B_k = \begin{bmatrix} \cos(\frac{2\pi k}{7}) & \sin(\frac{2\pi k}{7}) \\ -\sin(\frac{2\pi k}{7}) & \cos(\frac{2\pi k}{7}) \end{bmatrix} \end{align*}\] \[\begin{align*} & d_{i1} \sim \chi^2(10) \qquad d_{i2} \sim \chi^2(3) \\ \\ & \mathbf D_i = \begin{bmatrix} d_{i1} & 0 \\ 0 & d_{i2} \end{bmatrix} \\ \\ & \mathbf E_i \sim \mathscr W_2(\mathbf I, 10), \end{align*}\]

Acurracy of Recovery the True Groups

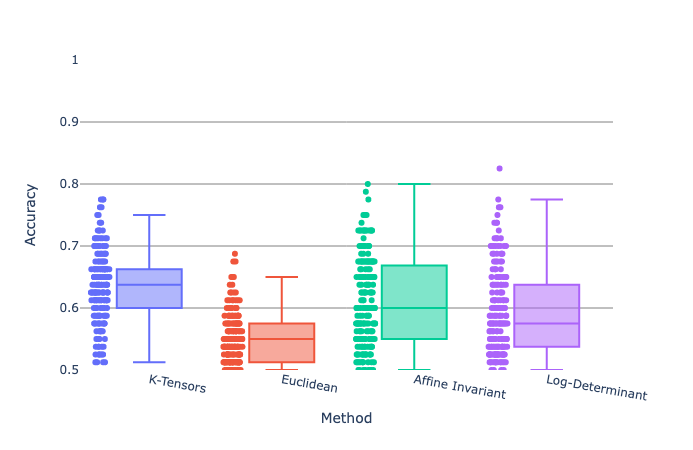
Simulation Setting 2

\[\begin{align*} & \mathbf Psi_k \sim \mathscr W_2(\mathbf \Sigma_k, n), \quad k = 1, 2\\ & \mathbf X_k \sim \text{Bivariate-Uniform}(0, 1) \\ & \mathbf \Sigma_k = cov(\mathbf X_k) \\ & n \sim \text{Uniform}(10, 60). \end{align*}\]

Acurracy of Recovery the True Groups

Real Data Analysis

Human Connectome Project

Data:

  • resting-state fMRI
  • 1003 healty patients

Variable Importance

Human Connectome Project

Data:

  • resting-state fMRI
  • 1003 healty patients

result:

  • Key Brain Regions: Linked to Alzheimer’s, schizophrenia, Parkinson’s, and dementia.
  • Cognitive Metrics: Indicate risks for anxiety, depression, and mood disorders.
  • Cognitive Fluidity: Correlates with OCD, ASD, schizophrenia, affecting treatment strategies.

Variable Importance

More on K-Tensors

K-Tensors

My Profile